On my current project, I need to monitor UNIX system performance. I’m currently waiting for a new version of application code to test, so I thought that I’d look into some of the UNIX performance counters that I’m going to monitor.
I’m very familiar with Windows performance monitoring but less so with UNIX, so I thought that I’d try to compare UNIX performance counters with Windows performance counters. When monitoring the performance of a UNIX system using LoadRunner you need to enable RSTATD on the server being tested.
Once you’ve enabled RSTATD it’s a simple matter to tell your LoadRunner controller to monitor the UNIX ststistics for the server under test. All you need is it’s IP address. Once you add the server to the list of monitored servers iN LoadRunner Controller you se a number of counters which LoadRunner can monitor.
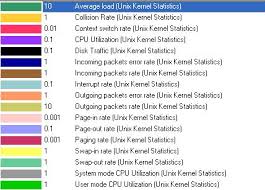
Many of these counters are broadly equivalent to Windows performance counters. The table below describes the equivalent Windows counter and describes it’s purpose. I’ve tried to define the UNIX counters and where applicable I’ve described the Windows and UNIX counters.
| UNIX counter |
Windows Counter |
Description |
| Average Load* |
N/A |
The sum of the number of processes waiting in the run queue plus the number currently executing. |
| Collision rate |
N/A |
The total number of network collisions/sec |
| Context switch rate |
System – Context Switches/sec |
The rate at which processors switch from executing one thread to another. High switch rates can indicate performance problems as servers juggle multiple running applications. |
| CPU utilisation |
%Processor Time |
The percentage of elapsed time that the process spends executing non-idle threads. |
| Disk traffic |
%Disk time |
The percentage of elapsed time that the disk(s) are busy servicing read or write requests. |
| Incoming packets error rate |
Packets received errors |
The number of packets received containing errors that precvent them from being delivered to a higher OSI layer protocol. |
| Incoming packets rate |
Packets received/sec |
The number of packets received on the network interface |
| Interrupt rate |
Interrupts/sec |
Average rate at which the processor receives and services hardware interrupts. Processes generate an interrupt when they finish a task and need to report that fact to the CPU. |
| Outgoing packets error rate |
Packets outbound errors |
The number of packets that can’t be transmitted due to errors |
| Outgoing packets rate |
Packets sent / sec |
The rate at which packets are sent on the network interface |
| Page-in rate |
Pages Input/sec |
The rate at which pages are read from disk to resolve hard page faults. Hard page faults occur when a process refers to a page in virtual memory which is not in it’s working set or available elsewhere in physical memory and has to be read from disk. |
| Page-out rate |
Pages Output/sec |
The rate at which memory pages are written to disk to free up space in physical memory. |
| Paging rate |
Paging rate |
The rate at which pages are read from disk or written to disk. This is the sum of Pages Input/sec and Pages Output/sec. |
| Swap-in rate |
N/A |
The number of pages read into memory per second |
| Swap-out rate |
N/A |
The number of pages written out of memory per second |
| System mode CPU utilization |
Processor – %Priviledged time |
The percentage of elapsed time that the processor spends executing user threads (i.e. running applications) |
| User mode CPU utilization |
Processor – %User time |
The percentage or elapsed time that the processor spends executing priviledged or system mode threads. |
*Average Load is not clearly defined and it is important to understand that it represents a moving average over time rather than a snapshot of actual performance. Because Load Average is the sum of two performance statistics (queue length and the number of processes currently executing) it is hard to use it to compare the performance of dissimilar systems. An Average Load which would be acceptable on one system might be unacceeptable on another. The best description that I’ve found for Average Load was “Linux Load Average – Not Your Average Average”, written by Neil Gunther of Performance Dynamics and it can be found at this URL. http://luv.asn.au/overheads/NJG_LUV_2002/luvSlides.html
Thanks to Tim Nichols of CheckPoint Technologies for his questions which encouraged me to clarify the description of Average Load.