If you run Mayan EDMS using Docker and rely on the default Whoosh search backend, you may eventually encounter this error:
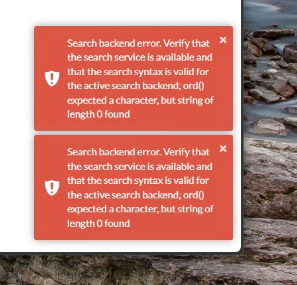
Search backend error. Verify that the search service is available and that the search syntax is valid for the active search backend; ord() expected a character, but string of length 0 found
This error can appear when performing a search, browsing documents, or even loading certain pages. The good news is that the cause is well‑understood and the fix is straightforward once you know where to look.
Understanding the Root Cause
Mayan’s default search engine, Whoosh, stores its index on disk inside the Mayan application volume. In multi‑container deployments, several containers (frontend, workers, Celery beat) all read and write to this index.
Over time, the Whoosh index can become corrupted due to:
Container restarts during indexing
Interrupted writes
Empty or malformed search queries
Upgrades that change index structure
When Whoosh encounters corrupted index data, it throws this cryptic Python error:
ord() expected a character, but string of length 0 found
This isn’t a Mayan configuration issue — it’s simply a damaged index.
The fix is to delete the Whoosh index directory and rebuild it cleanly.
Why This Is Tricky in a Multi‑Container Setup
In a standard single‑container deployment, you can simply exec into the container and delete the index.
But in a multi‑container setup, Mayan uses:
A frontend container
Multiple worker containers
A Celery beat container
A setup_or_upgrade container that runs migrations
All of these share the same /var/lib/mayan volume.
And because the Mayan entrypoint script always tries to connect to PostgreSQL before doing anything else, simply running:
Code
docker compose run frontend bash
causes the container to hang while waiting for the database.
To fix the index, you need a shell without:
Starting dependencies
Running the entrypoint
Triggering the upgrade container
The Correct Procedure
1. Open a shell inside the frontend container (bypassing entrypoint and dependencies)
This is the key step:
Code
docker compose --profile multi_container run --no-deps --rm --entrypoint /bin/bash frontend
This operation is safe, it removes only the index files, not your documents or metadata.
3. Restart Mayan normally
Exit the container, then:
Code
docker compose --profile multi_container up -d
All Mayan services will start cleanly.
4. Rebuild the index from the UI
In Mayan:
System → Tools → Rebuild Indexes
This regenerates the Whoosh index from your existing documents.
Why This Works
Deleting the index forces Whoosh to rebuild it from scratch. Because the corruption is in the index files — not the database — the rebuild produces a clean, functional search backend.
The error disappears immediately after the rebuild completes.
Final Thoughts
This issue is one of the most common problems encountered when running Mayan EDMS with the Whoosh backend, especially in multi‑container Docker deployments. The combination of shared volumes, multiple workers, and the strict entrypoint logic can make maintenance tasks feel more complicated than they really are.
Once you know how to bypass the entrypoint and access the filesystem directly, the fix becomes simple and reliable.
I’m still a bit of a newbie to Mayan EDMS and may post additional notes/guides here as I learn. (As much for my own reference as to help others, but I hope this is useful for you, or a future “me”) 😊
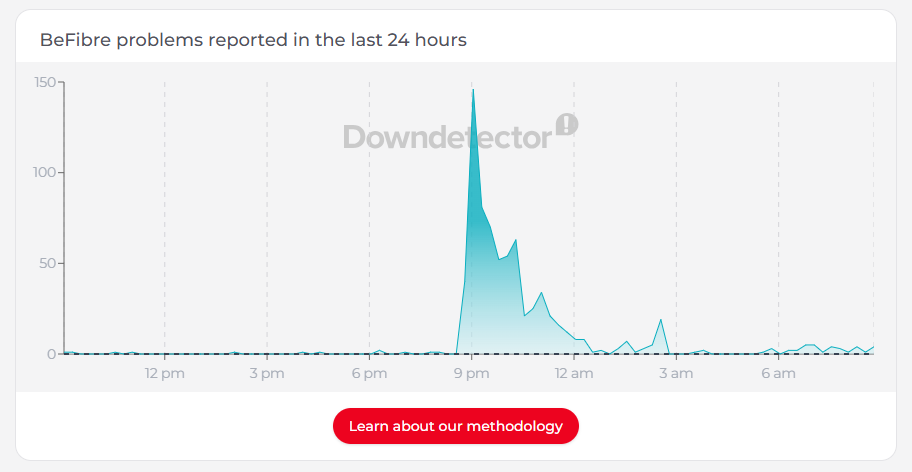
We’ve all been there: you’re mid-scroll or mid-game when the connection simply vanishes. Usually, it feels like a sudden snap—one second you’re online, the next you’re staring at a “No Internet” dinosaur. This happened to me and hundreds of other BeFibre customers last night.
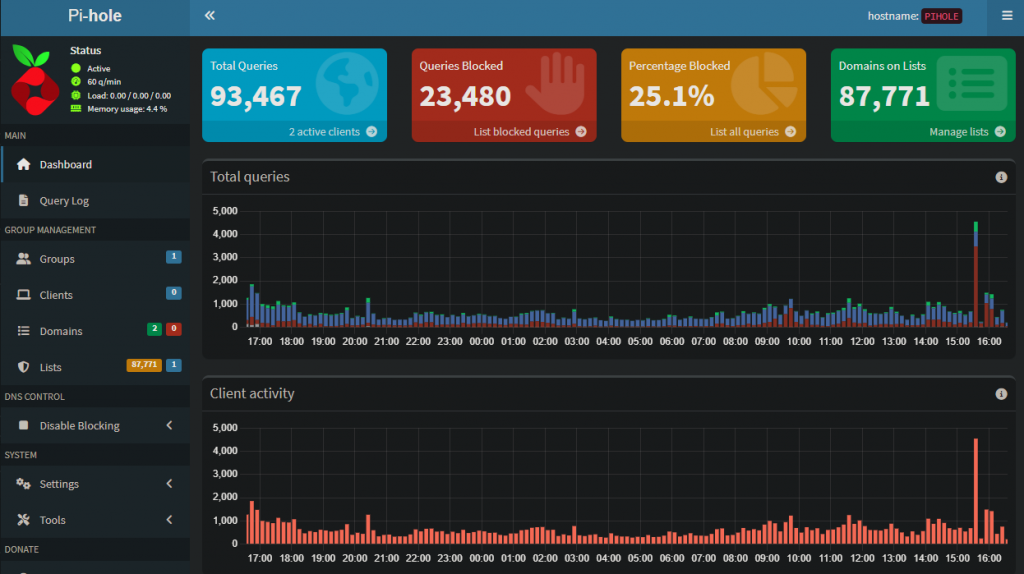
But last night, my network monitoring showed me something much more interesting. Before the lights went out on my ISP, my Pi-hole (a network-wide ad blocker and DNS sinkhole) captured a significant spike in traffic. It wasn’t a sudden surge in usage; it was the digital equivalent of my network devices “screaming” into a void.
The Network’s Digital “Death Throes”
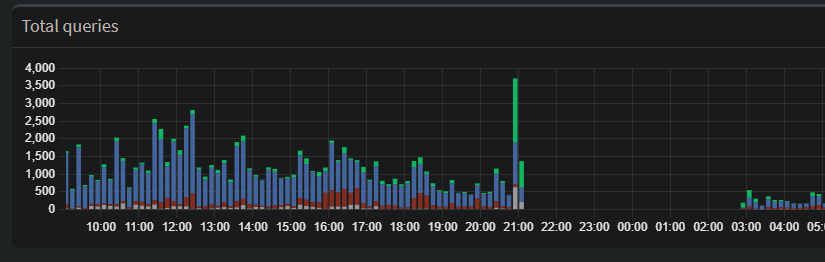
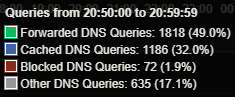
Looking at the dashboard data, you can see a large spike in forwarded DNS queries just before the total blackout. While it looks like my network was busier than ever, it was actually a textbook example of a Retry Storm.
Here is why this happens when an ISP begins to fail:
1. The Recursive Loop
When your ISP’s DNS servers start to lag or drop packets, your devices don’t just wait patiently. Modern operating systems are aggressive. If they don’t get a DNS resolution in a few milliseconds, they ask again. And again.
The Spike: Every smart bulb, phone, and laptop on the network starts firing off duplicate requests, trying to find a path out to the internet.
2. The Cache Collapse
Usually, a Pi-hole is great because it caches common addresses locally, saving time and traffic. But DNS records have a “Time to Live” (TTL).
As the ISP’s infrastructure flickered, my Pi-hole couldn’t refresh its cache.
Once those local records expired, every single request—even for common sites—had to be “forwarded” upstream to a failing server. This is why the Forwarded (green) bar in the graph towers so high over the Cached (blue) bar.
3. Failover Hunting
Many “smart” devices are programmed with a plan B. When the primary connection gets spotty, they start “hunting”—switching between IPv4 and IPv6, or trying to hit hardcoded servers like Google’s 8.8.8.8. This creates a chaotic surge of DNS activity as the hardware desperately tries to “phone home.”
The Canary in the Coal Mine
Because this outage ended up being a widespread regional issue, this data is a perfect “canary in the coal mine.” It suggests that the ISP’s DNS or routing table didn’t just break; it became congested first.
Whether it was a massive DDoS attack or a major hardware failure at a regional hub, the network didn’t go quietly. It struggled, it retried, and it flooded the logs with requests before finally falling silent.
The Takeaway
If you use a Pi-hole or similar local DNS resolver, keep an eye on your Forwarded vs. Cached ratio. A massive spike in forwarded queries without a change in your actual browsing habits is often the first sign that your ISP is about to kick the bucket.
Have you ever caught a network failure in real-time? Check your logs—the data might be more dramatic than you think.
If you rely on Pi-hole for network-wide ad blocking, you know the pain of “The Internet is down!” the moment you reboot your Raspberry Pi for updates. The solution? Two Pi-holes are better than one.
In this guide, I’ll explain how to set up a Primary and Secondary Pi-hole and use a tool called gravity-sync to ensure that when you allow a domain on one, it’s automatically allowed on the other.
In the config below, I’ll assume that your router is configured as follows: Router IP : 192.168.1.1 Default Gateway: 192.168.1.1 Subnet mask: 255.255.255.0 Router configured for DHCP with a range of 192.168.1.10-192.168.1.254 (This leaves a range of static addresses for me to use).
The Goal
Primary Pi:192.168.1.3 (Your Source of Truth)
Secondary Pi:192.168.1.4 (The Shadow)
The Result: Identical blocking lists and settings across both devices.
Step 1: Install Pi-hole on Both Devices
First, ensure both Raspberry Pis have a static IP address and a fresh install of Pi-hole.
Bash
curl -sSL https://install.pi-hole.net | bash
Follow the on-screen prompts. For the secondary Pi, you can use any upstream DNS (like Google or Cloudflare).
Step 2: Prepare the Secondary Pi (The Handshake)
For the Primary Pi to “talk” to the Secondary Pi without asking for a password every five minutes, we need to set up a secure handshake.
1. Create the SSH Key (On the PRIMARY)
Run this on your Primary Pi:
Bash
# Create a dedicated key for syncing
ssh-keygen -t rsa -b 4096 -f /etc/gravity-sync/gravity-sync.rsa -N ""
(Enter your password one last time. Now, the Primary can “log in” to the Secondary automatically.)
3. Grant “Sudo” Permissions (On the SECONDARY)
This is where many people get stuck. Pi-hole requires root privileges to reload. We need to allow the sync process to reload the DNS engine without a password. On the Secondary Pi, run:
Bash
sudo visudo
Scroll to the bottom and add this line:
Plaintext
admin ALL=(ALL) NOPASSWD: /usr/local/bin/pihole
Step 3: Install and Configure Gravity Sync
Now, we install the bridge that connects the two. We do this on the Primary Pi.
The automated wizard can sometimes trip over version differences, so we will manually tune the configuration file. Open it on your Primary Pi:
Bash
sudo nano /etc/gravity-sync/gravity-sync.conf
Paste this exact configuration (replacing IPs as needed):
Plaintext
# REMOTE SETTINGS
REMOTE_HOST='192.168.1.4'
REMOTE_USER='admin'
SSH_PKI='/etc/gravity-sync/gravity-sync.rsa'

# THE RELOAD FIX (CRITICAL)
# These lines ensure the secondary actually loads the new data
REMOTE_FTL_RELOAD='sudo pihole reloaddns'
RELOAD_FTL='sudo pihole reloaddns'

# OPTIMISATION
SKIP_DNS_CHECK='1'
Step 4: The First Sync
On your Primary Pi, let’s run the first manual push to make sure everything is working:
Bash
gravity-sync push
Look for ✓ Pushing the local Gravity Database and ✓ Reloading remote FTLDNS services. If you see those, you are successful!
Step 5: Set it to Autopilot
Finally, tell Gravity Sync to run in the background. It will detect any changes you make to the Primary (like adding a new allowlist domain) and push them to the Secondary within minutes.
Bash
gravity-sync auto
How to use your new Setup
Management: Always add your new “Allow” or “Deny” domains on the Primary Pi UI (192.168.1.3/admin).
Router Config: Set your Router’s DNS settings to point to both IPs.
Primary DNS: 192.168.1.3
Secondary DNS: 192.168.1.4
Failover: If you need to take the Primary Pi offline for an update, your network won’t even blink. The Secondary Pi is already running with an identical copy of your rules.