I have a pretty decent quad-core PC at home with 8GB RAM and performance generally isn’t an issue for me. This spec is more than adequate to run the occasional virtual machine for testing and evaluation purposes as well as handle standard business applications such as word processing, email, video conferencing etc.
At the moment, my performance counters are reasonably healthy; under normal use, I typically use between 10-25% of my processing capacity and about 2/3 of my available memory. This is normal for me and has been consistent for more than 12 months. The only exception to this tends to be when I edit HD videos or do other things such as saving recorded TV shows to DVD using media centre.
The problem
I work as an application performance tester which means that I’m pretty inquisitive when it comes to how computers perform. This may be the reason that I tend to leave Windows Gadgets on my desktop reporting CPU and memory use in real-time.
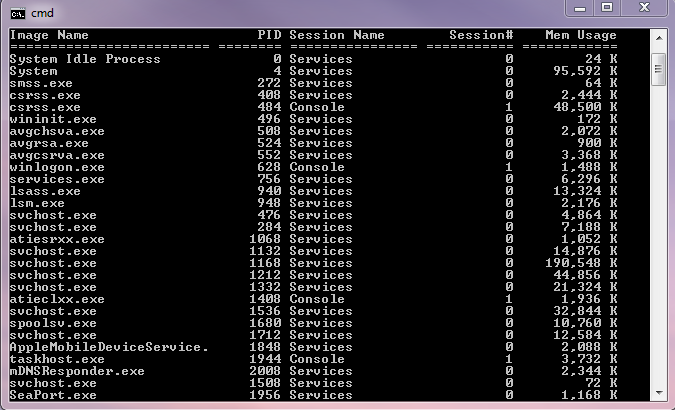
For some time, I’d been noticing that the third core of my quad core processor (an Intel i5 750) was busier than the other cores. I thought that I’d have a look at Windows Task Manager to see what was using my CPU cycles. When I looked at Task Manager I was surprised to see that the total amount of CPU in use was consistently less than that shown by my desktop gadget.

I tried the usual tricks, including choosing “show processes from all users” to see whether a system account was using CPU.
In short I was stumped…..
Diagnosis
I decided that perhaps I should dig a little deeper, so I installed Process Explorer.
Process Explorer shows you more detailed information about currently running processes and I was pleased to see that it showed me the increased activity on core 3. As well as showing me this extra activity it also showed that the bulk of activity was down to interrupts, rather than context switches or deferred procedure calls.

15-17% of all CPU activity was handling hardware interrupts so one core was almost fully occupied.

The (wrong) conclusion
I knew that I shouldn’t have any hardware device generating this large number of interrupts, so I thought that I’d work out what was causing the problem by a process of elimination. I decided to check external devices first because this was easier and I suspected that these devices were more likely to be faulty. I disconnected the scanner, printer, external USB hub, speakers, drawing pad etc. but the problem remained.
This meant that the problem had to be inside the PC, so I started to disconnect internal components such as my DVD drive, after disconnecting everything that I could, I rechecked and the problem still remained. Because my graphics card passed a diagnostic check and I was running out of other options, I decided that it must be my hard drive.
This was both right AND wrong.
The (correct) conclusion
After replacing my hard drive at first the problem seemed to have resolved itself. I’m not sure how this problem seemed to be fixed for a short while, but after a couple of days the problem came back.
I decided to overhaul the PC from a software perspective. I performed a Windows update to upgrade any drivers that were out of date, and then I decided to check for new drivers for my hard disk.
In device manager I right-clicked on the hard disk and chose the option to “Update Driver Software”. I didn’t really expect this to work but after a reboot the problem had gone.

After several months, I’m happy to report that my PC is still working normally.
All cores have similar utilisation levels.

Interrupts is no longer visible in the top of the list of active processes.

If only I checked for updated drivers before I spent the best part of £80 on a new drive.
Ah well, at least I learnt something new, and I now have a spare hard drive for backups!