UNIX performance monitoring with LoadRunner

On my current project, I need to monitor UNIX system performance. I’m currently waiting for a new version of application code to test, so I thought that I’d look into some of the UNIX performance counters that I’m going to monitor.

I’m very familiar with Windows performance monitoring but less so with UNIX, so I thought that I’d try to compare UNIX performance counters with Windows performance counters. When monitoring the performance of a UNIX system using LoadRunner you need to enable RSTATD on the server being tested.

Once you’ve enabled RSTATD it’s a simple matter to tell your LoadRunner controller to monitor the UNIX ststistics for the server under test. All you need is it’s IP address. Once you add the server to the list of monitored servers iN LoadRunner Controller you se a number of counters which LoadRunner can monitor.


download


Many of these counters are broadly equivalent to Windows performance counters. The table below describes the equivalent Windows counter and describes it’s purpose. I’ve tried to define the UNIX counters and where applicable I’ve described the Windows and UNIX counters.


UNIX counter Windows Counter Description
Average Load* N/A The sum of the number of processes waiting in the run queue plus the number currently executing.
Collision rate N/A The total number of network collisions/sec
Context switch rate System – Context Switches/sec The rate at which processors switch from executing one thread to another. High switch rates can indicate performance problems as servers juggle multiple running applications.
CPU utilisation %Processor Time The percentage of elapsed time that the process spends executing non-idle threads.
Disk traffic %Disk time The percentage of elapsed time that the disk(s) are  busy servicing read or write requests.
Incoming packets error rate Packets received errors The number of packets received containing errors that precvent them from being delivered to a higher OSI layer protocol.
Incoming packets rate Packets received/sec The number of packets received on the network interface
Interrupt rate Interrupts/sec Average rate at which the processor receives and services hardware interrupts. Processes generate an interrupt when they finish a task and need to report that fact to the CPU.
Outgoing packets error rate Packets outbound errors The number of packets that can’t be transmitted due to errors
Outgoing packets rate Packets sent / sec The rate at which packets are sent on the network interface
Page-in rate Pages Input/sec The rate at which pages are read from disk to resolve hard page faults. Hard page faults occur when a process refers to a page in virtual memory which is not in it’s working set or available elsewhere in physical memory and has to be read from disk.
Page-out rate Pages Output/sec The rate at which memory pages are written to disk to free up space in physical memory.
Paging rate Paging rate The rate at which pages are read from disk or written to disk.  This is the sum of Pages Input/sec and Pages Output/sec.
Swap-in rate N/A The number of pages read into memory per second
Swap-out rate N/A The number of pages written out of memory per second
System mode CPU utilization Processor – %Priviledged time The percentage of elapsed time that the processor spends executing user threads (i.e. running applications)
User mode CPU utilization Processor – %User time The percentage or elapsed time that the processor spends executing priviledged or system mode threads.


*Average Load is not clearly defined and it is important to understand that it represents a moving average over time rather than a snapshot of actual performance. Because Load Average is the sum of two performance statistics (queue length and the number of processes currently executing) it is hard to use it to compare the performance of dissimilar systems. An Average Load which would be acceptable on one system might be unacceeptable on another. The best description that I’ve found for Average Load was “Linux Load Average – Not Your Average Average”, written by Neil Gunther of Performance Dynamics and it can be found at this URL. http://luv.asn.au/overheads/NJG_LUV_2002/luvSlides.html

Thanks to Tim Nichols of CheckPoint Technologies for his questions which encouraged me to clarify the description of Average Load.

Creating uniquely named log files with details of running processes (TASKLIST)

Thanks to Scott Moore (at LoadTester.com) for the idea behind this article and to the owners of DOStips.com for their article on DOS string manipulation which I used to get the string concatenation right.

When running performance tests or any kind of performance analysis it can be useful to know the processes running on a PC or server which are consuming resources. The Windows command TASKLIST gives a list of currently running processes (basically a text based version of what the Task Manager process tab shows you).

TASKLIST screenshot

By piping the output of this file to a text file you can save details of the running processes for later analysis.

Scott’s article described a batch file which you could run before and after certain events such as batch processing or performance tests to create uniquely named log files containing the TASKLIST information. I had some difficulty getting his time and date stamps to work, possibly due to the timezone settings in Windows which “regionalise” the date and time environment variables. I’ve modified his original batch file to this one below which seems to work on UK PCs running Windows 7, Windows Vista and Windows XP.

Sample Code

for /f “tokens=1-3 delims=/ ” %%d in (“%date%”) do set d=%%d-%%e-%%f

for /f “tokens=1-3 delims=:” %%d in (“%time%”) do set t=%%d%%e

set timestr=%d:~6,4%%d:~3,2%%d:~0,2%-%t:~0,2%%t:~2,2%

tasklist /FO CSV > TASKLIST_Logfile_%timestr%.csv


This creates a CSV file named TASKLIST_Logfile_YYYYMMDD-HHMM.csv formatted like the sample below.
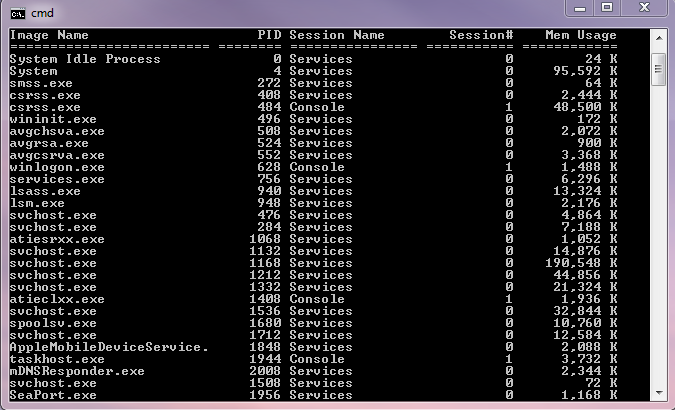

Sample Output

“Image Name”,”PID”,”Session Name”,”Session#”,”Mem Usage”

“System Idle Process”,”0″,”Services”,”0″,”24 K”

“System”,”4″,”Services”,”0″,”95,672 K”

“smss.exe”,”272″,”Services”,”0″,”64 K”

“csrss.exe”,”408″,”Services”,”0″,”2,484 K”

“csrss.exe”,”484″,”Console”,”1″,”73,224 K”

“wininit.exe”,”496″,”Services”,”0″,”172 K”

“avgchsva.exe”,”508″,”Services”,”0″,”25,816 K”