Some political leaflets dropped through the letterbox today and I was initially angry and then dismayed by what I read. The local Labour group in Rossendale is complaining that they get less funding than wealthier parts of Southern England. They used this graphic to demonstrate the shortfall.
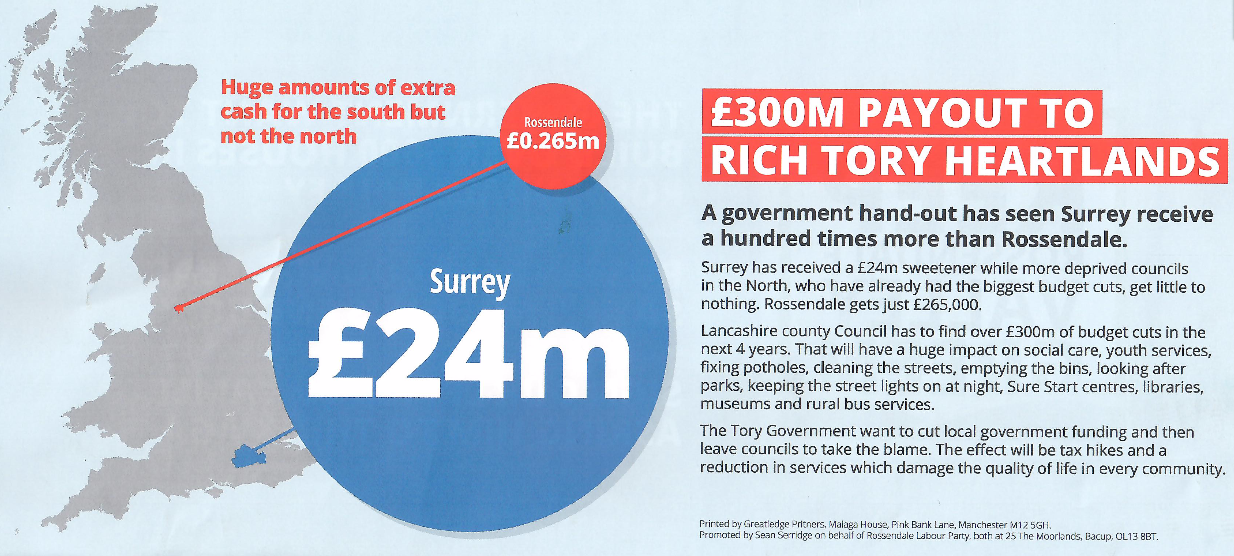
The headline grabbing statistic is that Surrey received 100x more funding that Rossendale. Even the more dim-witted parts of the electorate should be able to see that Rossendale (the tiny red-coloured speck in the North) is significantly smaller than the Surrey (the large blue blob in the South).
A fairer comparison would have been to compare the per capita spending.
According to Wikipedia Surrey has a population of 1,058,000 and Rossendale has a population of 65,652. Based on this, Surrey still receives significantly more funding than Rossendale (but only 16x more).
An even fairer comparison would be to compare Lancashire County Council with Surrey County Council. County Councils, such as Lancashire or Surrey are responsible for funding the local Fire and Police Services as well as libraries, schools, social care, road building and so on. Lancashire County Council takes much of this burden away from Rossendale, so the figures in the graphic are effectively meaningless.
I don’t mind receiving information through the post, I like to keep well-informed. Sadly the above image isn’t designed to inform the electorate. I’m insulted that the local Labour group thinks that I’m stupid enough to take it at face value.
I’d be very interested to see a central government funding comparison (per capita) comparing Surrey and Lancashire.