Last night I was “playing around” with a new product that we have under development at TrustIV. The application tests the relative performance of different websites and ranks them. A couple of the sites that it was monitoring seemed to be experiencing problems.
Showcase cinemas was offline.
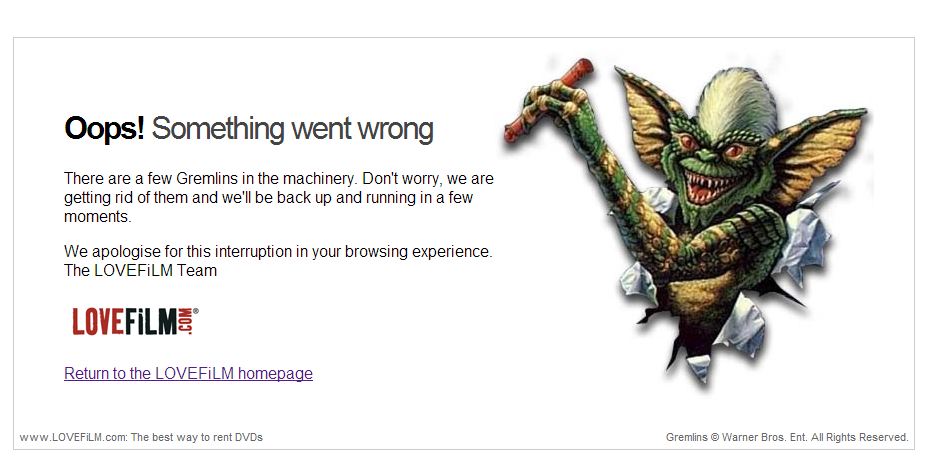
So was “LoveFilm”. (I particularly like their error page referring to Gremlins).
As well as this asda.com, coventry building society and ToysRus were all experiencing outages.
I confirmed this with my own browser but I found it odd that they were all offline.
Perhaps they all sit on the same cloud server….who knows. I’m going to keep monitoring these sites and I’ll report back here and on the TrustIV blog when I have more news.
Launch a local currency to help support the local economy in Bristol.
Encourage people to support local businesses.
Boost local spending power and lock money into the Bristol economy.
This all sounds great, but I just went to their website at https://bristolpound.org and the page took more than 3 minutes to download. Now I’m not blessed with the world’s fastest Internet connection in the office, but that’s a lot longer than most people are prepared to wait.
I was reminded of a couple of StrangeLoop infographics:
The first one describes web user’s boredom thresholds and shows that people abandon slow sites quickly, many never return and even worse, they tell their friends about their bad experience. This can be very damaging for a brand that puts so much effort into their day 1 launch.
The second infographic documents the increasing size of pages over time. I know that we all use high speed internet connections nowadays, but if a lot of people start to hit your site, you’re going to run out of bandwidth to serve the requests pretty quickly.
I think that the Bristol Pound website is suffering from “page bloat” and here’s why…
Using a Firefox browser with an empty cache and Firebug, I connected to http://bristolpound.org and saw that it took almost 3 minutes for the page to download completely. The page looks great and is graphically rich, but it doesn’t perform well for those first-time visitors hitting the site today.
The image below which is taken from the HAR (HTTP archive) file that I created shows a single image taking 2.33 (139 seconds) minutes to download. The large/slow image is called FINAL_Launch_POSTER_copy.jpg , and it is advertising tonight’s launch party for the Bristol Pound.
The main problem with this image is that somebody has uploaded the full size image to the website and rescaled it using HTML. The original image size is 3,508 x 4,966 pixels which is huge, but it is displayed at only 338 x 495 pixels. Serving a scaled-down image could save 1.8MB of bandwidth for each page request (a 99% size reduction). This would reduce the download time for this component from about 139 seconds to less than 2 seconds. This alone would significantly improve user’s first impressions of the site.
This screenshot shows the “offending image” highlighted in red.
There are other improvements that could be made, but to improve performance for now, I’d simply resize the image in an image editor (MSPAINT would do) and then keep my fingers crossed…..
I’m a member of a LinkedIn group called “Performance Testing“. This morning a member of the group from BlazeMeter posted a link to their blog article about how much detail to put into a performance test report.
Historically I’ve always put large amounts of detail into performance test reports, but over the last 12 months or so I’ve started to reduce the amount of content. This allows me to produce what the customer generally wants in a shorter time frame.
In most performance tests customers tend to want to know the answer to one question: Will my application perform well under expected user load?
This can generally be answered with “yes” or “no”, although occasionally the answer is “maybe”. (I tend to use traffic lights to show this at a high level.)
Often much more information than this is simply wasting time. In the last year or so I’ve started to produce reports in Powerpoint that can be easily referred to in conference calls or webinars, be presented to clients at their site and can be re-used internally by my client’s project managers when they want to pass on information to their own internal customers.
I have found that by including less high-level detail and including embedded spreadsheets, charts or other documents allowing technical readers to “drill down” to the detail; I can keep all the potential readers of my reports happy.
I’ve attached a PDF “mock up” of a performance test report based on a test that I ran for a client earlier this year. I’d be interested to hear any comments from other testers about what works for them.